ELECTRICAL RESISTIVITY METHOD
ELECTRICAL RESISTIVITY METHOD
During resistivity survey a direct current is introduced into the ground through two current electrodes A and B inserted in the ground surface. The potential electrodes M and N are inserted in the ground between the outer current electrodes A and B where the potential difference is measured across these two potential electrodes. By measuring the current (I) between the two current electrodes A and B and the N, resistivity of the corresponding subsurface medium enclosed between the current electrodes is obtained.
Normally, the medium is inhomogeneous or anisotropic therefore, the resistivity is known as apparent resistivity and is computed by the following formula:
SPONTANEOUS LOG
RESISTIVITY LOG
GAMMA RAY LOG
NEUTRON LOG
The measurement of induced gamma ray activity due to the capture of neutrons emitted from a suitable source. Gamma ray and neutron logs provide information about the nature of the strata penetrated and give a measure of the hydrogen-bearing fluid content.
TEMPERATURE LOG
PHOTOELECTRIC LOG
Changes in the opacity of drilling fluid, determined by photo-electric means, can locate the source of influx of formation water into a borehole.
Equation (1) is the general equation for calculating apparent resistivity in electrical resistivity prospecting.
The apparent soil resistivity obtained in this case represents an average value of the soils within the sphere of influence of the test set up.
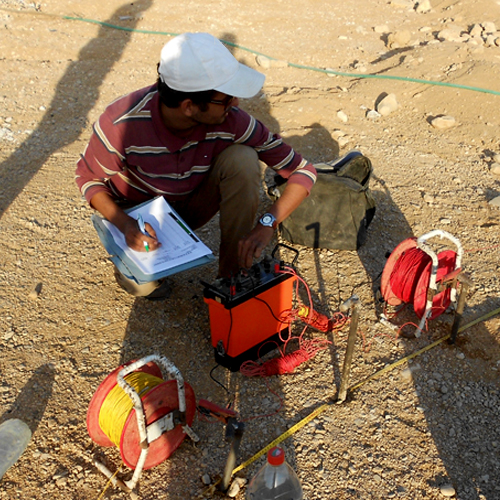
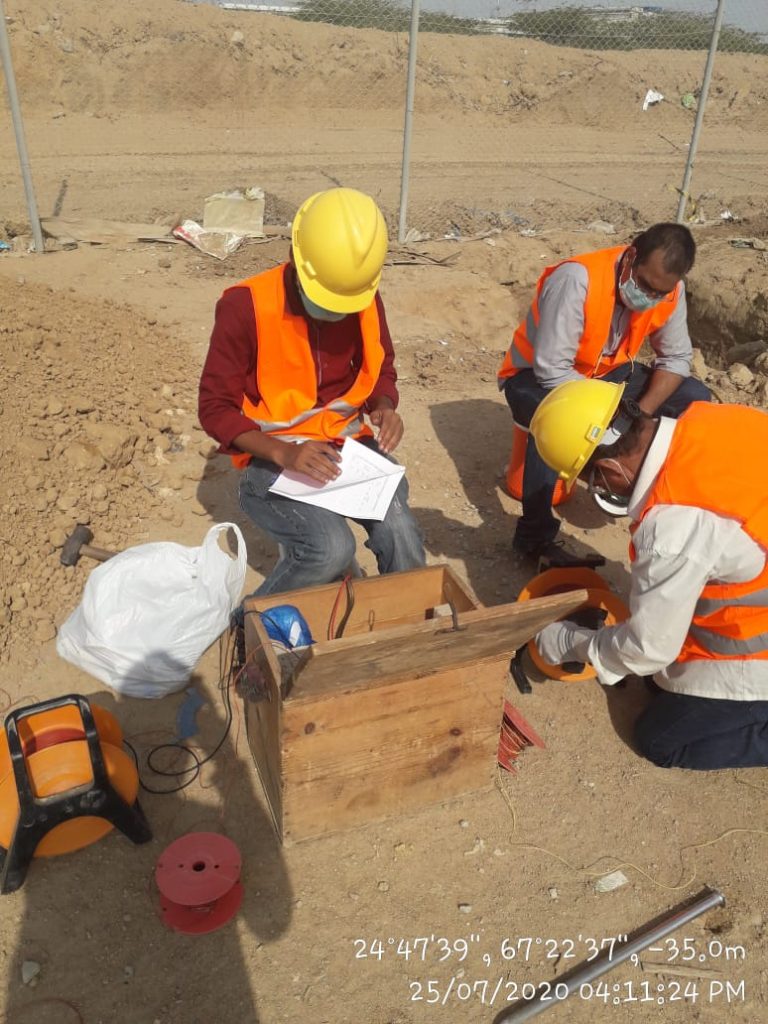
FIELD PROCEDURE
Signal averaging resistivity-measuring equipment (SAS-4000) is used for measuring current and potential values in the filed. `in the case of the Schlumberger array the electrodes are placed in a straight line symmetrically about the center point. The two outer electrodes A and B are used for the current, and the resulting potential difference is measured across the two inner electrodes M and N. The array is characterized by the distance of the current and potential electrodes from the center, which are referred to AB/2 and MN/2 respectively. MN/2 is always kept sufficiently small relative to AB/2. The average potential gradient measured between M and N is a close approximation to the potential gradient at the center of the array.
The ground is energized through the outer A and B electrodes under high D.C. voltage and constant current is made to flow through the ground with the help of “Power Pack” provided with the measuring equipment. The constant selected current I (In milli amperes) passing through the two current electrodes and resulting potential difference V (in milli/micro volts) between the two potential electrodes is processed by the equipment and the resistance is displayed for the corresponding reading.
The distance between the two potential electrodes is smaller than the distance between both potential electrode and its adjacent current electrode. Measurements are taken and noted before re-positioning the electrodes. The mid point of the electrodes is fixed at the sounding location, while the length of the configuration is gradually increased accordingly in order to measure the resistivity at given depth level. At each location, in one sounding, apparent resistivity values are obtained at different specific depths.
METHOD OF EVALUATION
The resistivity filed curves are obtained by plotting the apparent resistivity values against depths on a bi-log graph paper. After smoothing the plotted curves all the field data is registered to computer. The interpretation of sounding is done with the help of computer and direct interpretation software. The resistivity sounding data collected from the area is interpreted by computer-aided techniques using INTERPEX USA software, RESIXP. The layer models are calculated by an interactive procedure. During each iteration, the model parameters are adjusted and the deviation of the corresponding curve from the measured curve is checked. The deviation is defined by the RMSE (root mean square error), which is displayed after each iteration. At the end of calculations, the model, which results in the smallest error, is plotted showing layer’s true resistivity and corresponding thickness.
In practice, interpretation of resistivity sounding is invariably subjected to the principle of equivalence i.e. any resistivity sounding can be matched with several slightly deviating model curves, representing different sub-surface resistivity stratification depending upon ground water behavior of the area. The interpreter of the data is therefore, confronted with hundreds of options for a single field curve to make his selection of the most consistent model of the sub-surface conditions.
The interpreted or so called true resistivity values of the sub-surface layers and the calculated formation factor of the area have been used to estimate electrical conductivity of the ground water for the interpreted layers. The interpreted sub-surface hydrogeological conditions are shown in the form of vertical columns at respective sounding points in depicting sub-surface hydrogeological conditions.
INTERPRETATION OF V.E.S. DATA
The measured resistivities when subjected to interpretation process have yielded sub-surface electrical layers. These interpreted electrical layers need a correlation with the sub-surface geological conditions. This transformation of interpreted layers into lithologic units is essential based on the geological information obtained from test holes, tube wells, and other data of previous investigations conducted in the project area. The interpreted sub-surface conditions at each sounding location are derived in terms of resistivity.